In our previous article , we compared a website’s technical foundations to pizza dough and its content to the toppings. Those foundations allow bots to access content, creating the conditions for search visibility and potential AI citations.
This time, consider the thickness of the crust.
There was a time when visiting a website meant watching a Flash introduction, downloading large images and waiting for a video to start. The screen was full of branding, while the information readers wanted sat behind it. The experience resembled a pizza whose thick, cheese-filled crust took considerable effort to get through before reaching the toppings.
Websites in the mobile and AI era have different requirements. People need to reach the main content quickly, understand it with fewer processing steps and use the features they need without delay. A lighter crust lets the toppings stand out. Website optimisation starts with that same purpose.
The question mobile brought into focus: how soon can I start reading?#
Speed and reducing page weight have long been technical priorities in SEO. As people began consuming content on their phones while travelling, network conditions, device processing power and screen size became more significant. A page that runs smoothly on an office PC can still keep a mobile reader waiting.
The Bootstrap 3 announcement in 2013 emphasised mobile-first design and responsive layouts. Progressive web apps , which gained traction later, extended web experiences through installation, standalone windows and offline capabilities. Both developments reflect the need to deliver content and features reliably across mobile screens and connection conditions.
Using these tools does not automatically produce a lightweight website. The result depends on the files downloaded, the code executed and the order in which content appears.
Google’s Core Web Vitals address loading performance, responsiveness and visual stability. For readers, the questions are straightforward: When can I start reading, and when will the button I press respond?
Reduce downloads, execution and waiting#
During a recent consulting engagement with AENTS , we compared website optimisation to going on a diet. The aim was to deliver information faster and more concisely while presenting the content more clearly.
A website’s weight cannot be described by file size alone. At least three factors need attention:
- What the device downloads: images, fonts, CSS, JavaScript and external resources.
- What the device processes: parsing and executing code, calculating layouts and repainting the screen.
- What delays access to content: the requests and dependencies that must finish before the main information appears.
Two pages with similar file sizes can create different waiting times if one delays its main image and text. The web.dev guide to performance budgets recommends managing file sizes and request counts alongside the timing of content that matters to users.
The capacity recovered by removing unnecessary work can support readable tables, useful comparison tools and responsive interactions. Refining the dough creates a better foundation for enjoying the toppings.
GEO adds more ways for content to be retrieved#
Discussions about AI repeatedly return to processing capacity, electricity and data centres. The IEA’s Energy and AI report examines AI alongside data-centre electricity demand. Processing information requires physical resources.
For website operators, this invites a practical question: what work is necessary to deliver our content? There is no basis here for converting a few kilobytes saved on a webpage directly into a quantified reduction in AI data-centre electricity use. The scope we can manage is how our content is transferred, processed and displayed.
JavaScript needs to be considered in that context. Googlebot executes and renders JavaScript . Other bots do not necessarily provide the same capabilities. There are also approaches that combine a visual browser with a text-based browser, as described in OpenAI’s introduction to its agent .
The blanket claim that AI does not read JavaScript websites is therefore too broad. A more useful implementation question is: What extra execution and requests are required to read the main content?
Making titles, descriptions, key figures and links available in the initial HTML makes it easier to serve access methods with different JavaScript capabilities. This is also why we retain a chart’s key values in an HTML table. The visual presentation and the structure that conveys its meaning need to be designed together.
With a headless CMS, content delivery still matters#
A headless CMS separates content management from the system that presents the content. Hugo is a static site generator that produces HTML before deployment. They serve different roles and can be used together in some architectures.
What matters is what happens after a visitor requests a page. The server can deliver prepared HTML immediately, or the browser can wait for APIs and scripts before assembling the main content. The delivery architecture should match the content and its update requirements.
In 2026, 247COMPASS moved its long-running WordPress website to Hugo. As described in our migration article , the work involved refining content operations and the way pages are delivered.
I am fairly persistent about performance. On the 247COMPASS website, that persistence informs decisions about image dimensions and formats, fonts, CSS, unnecessary code and features used only on relevant pages. Hugo does not perform all of this work on its own. An architecture capable of fast delivery still needs detailed optimisation.
The 247COMPASS example, supported by measurements#
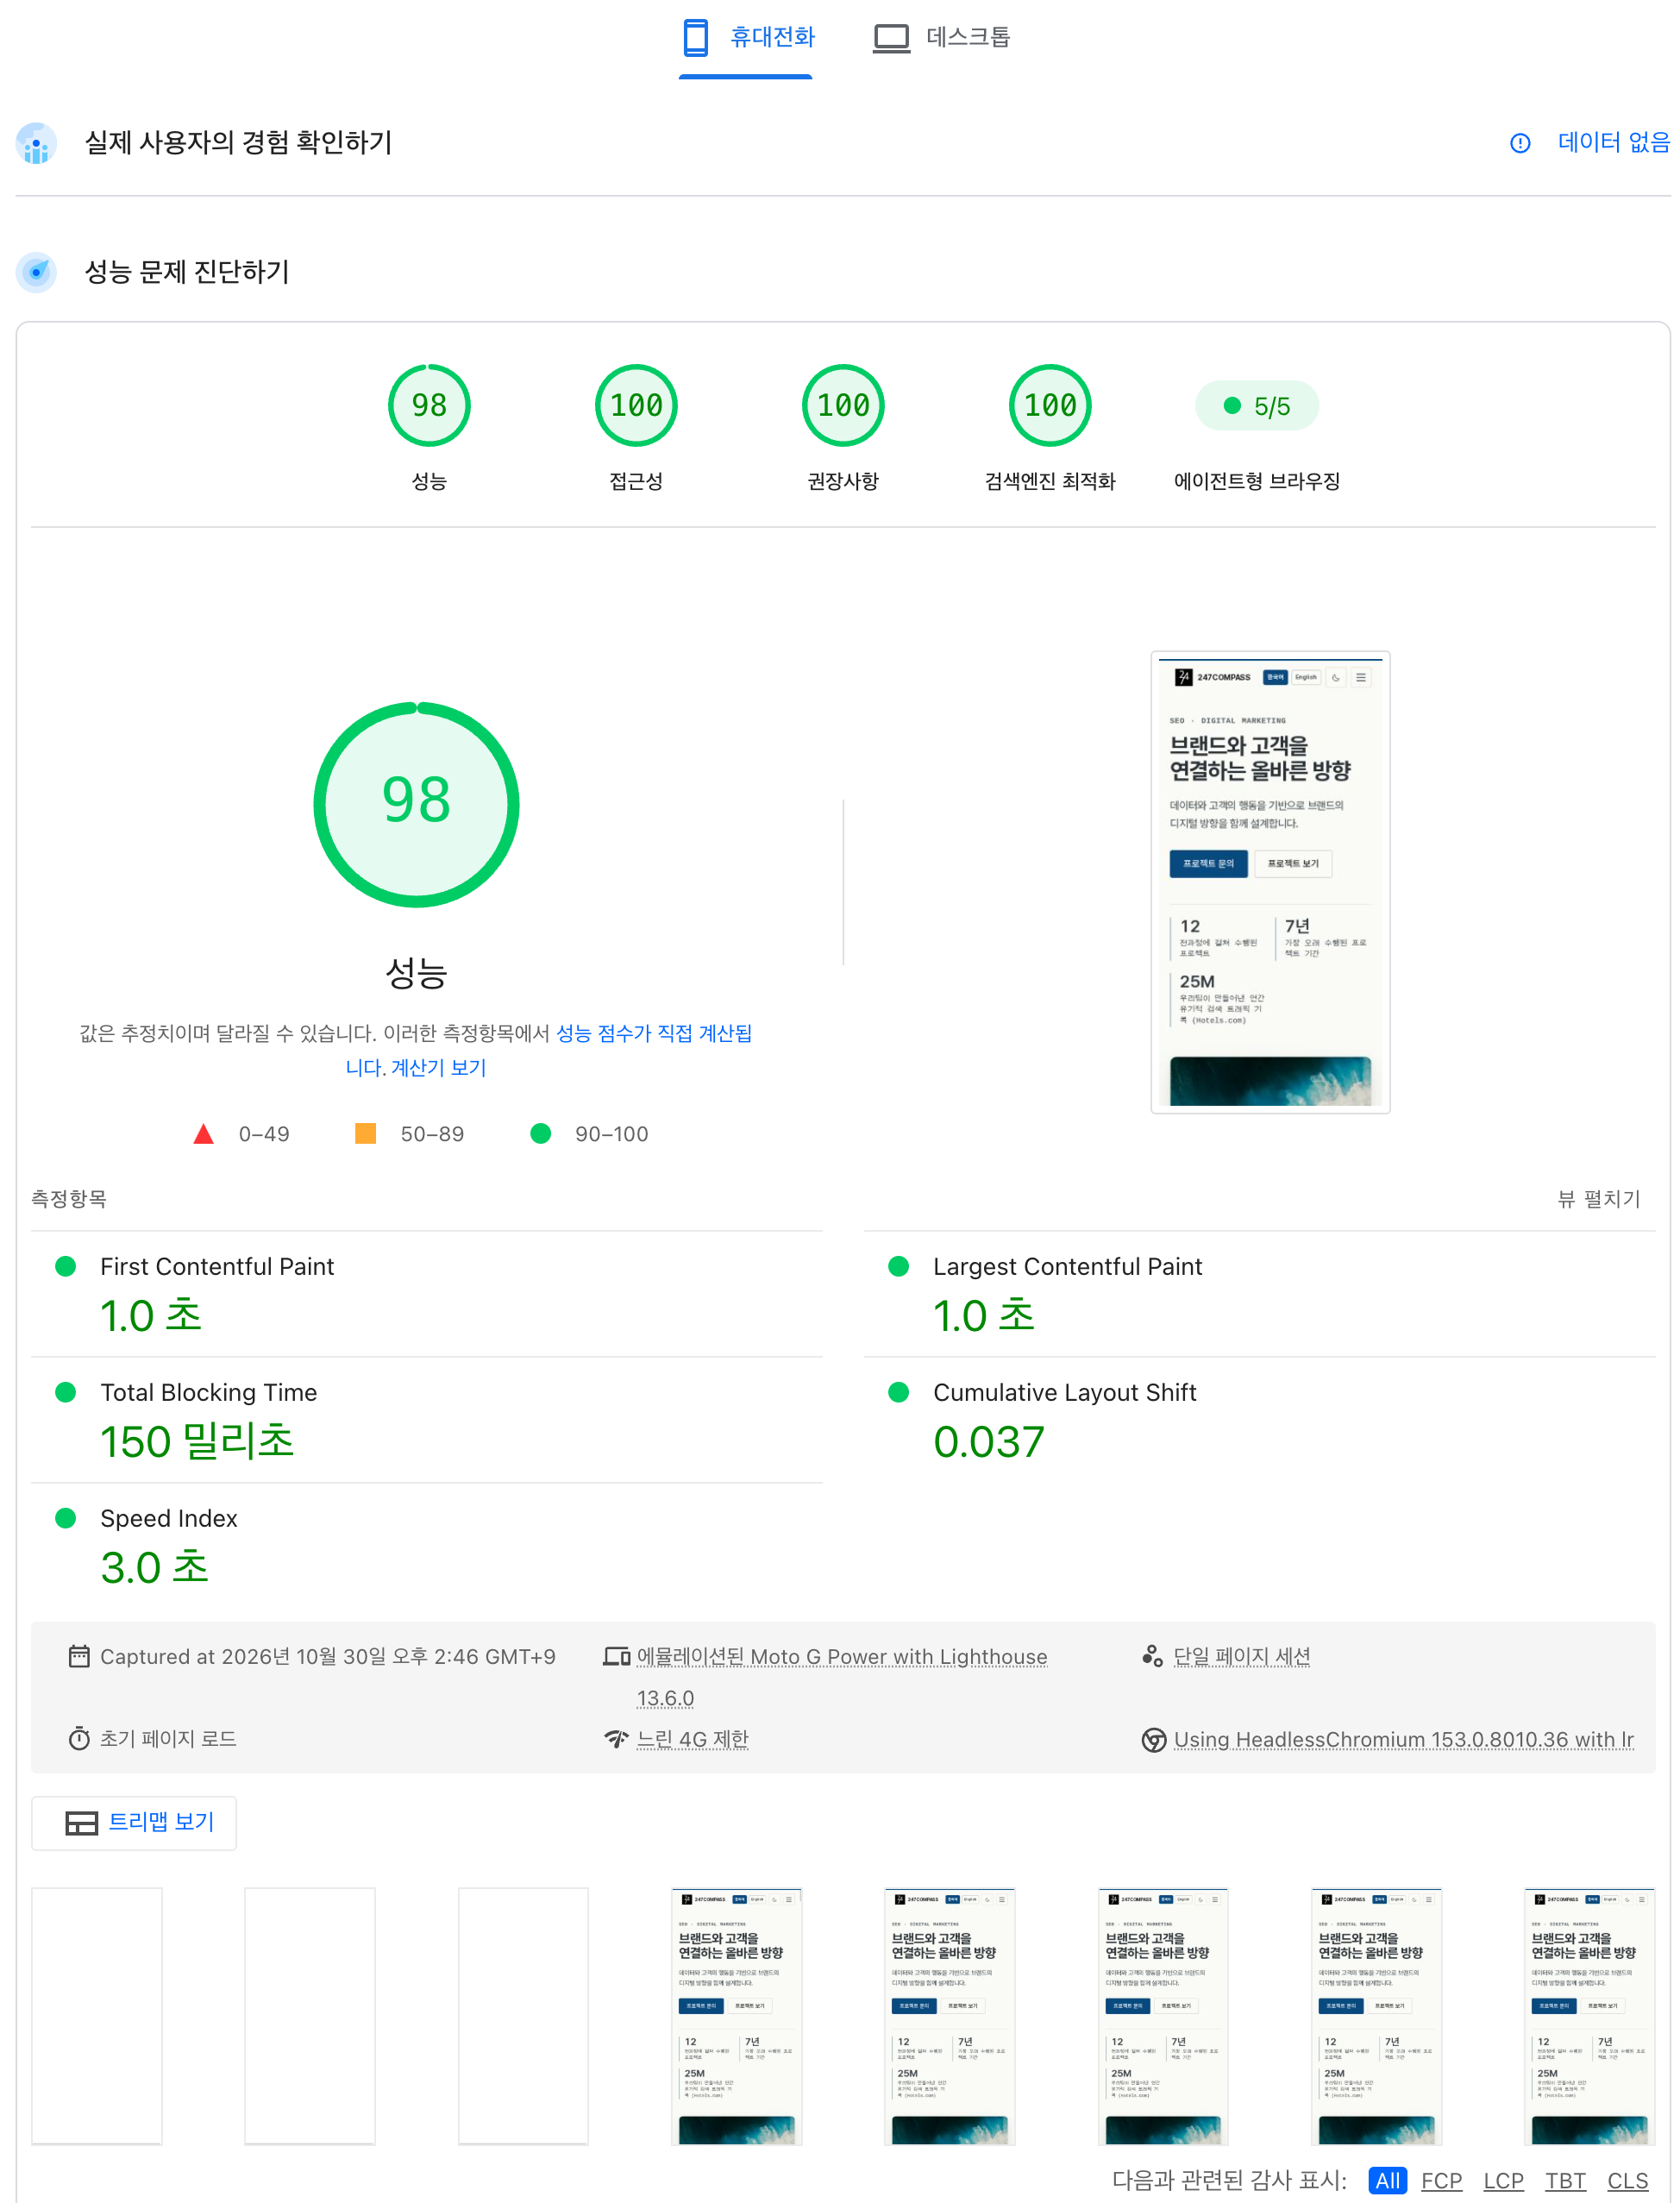
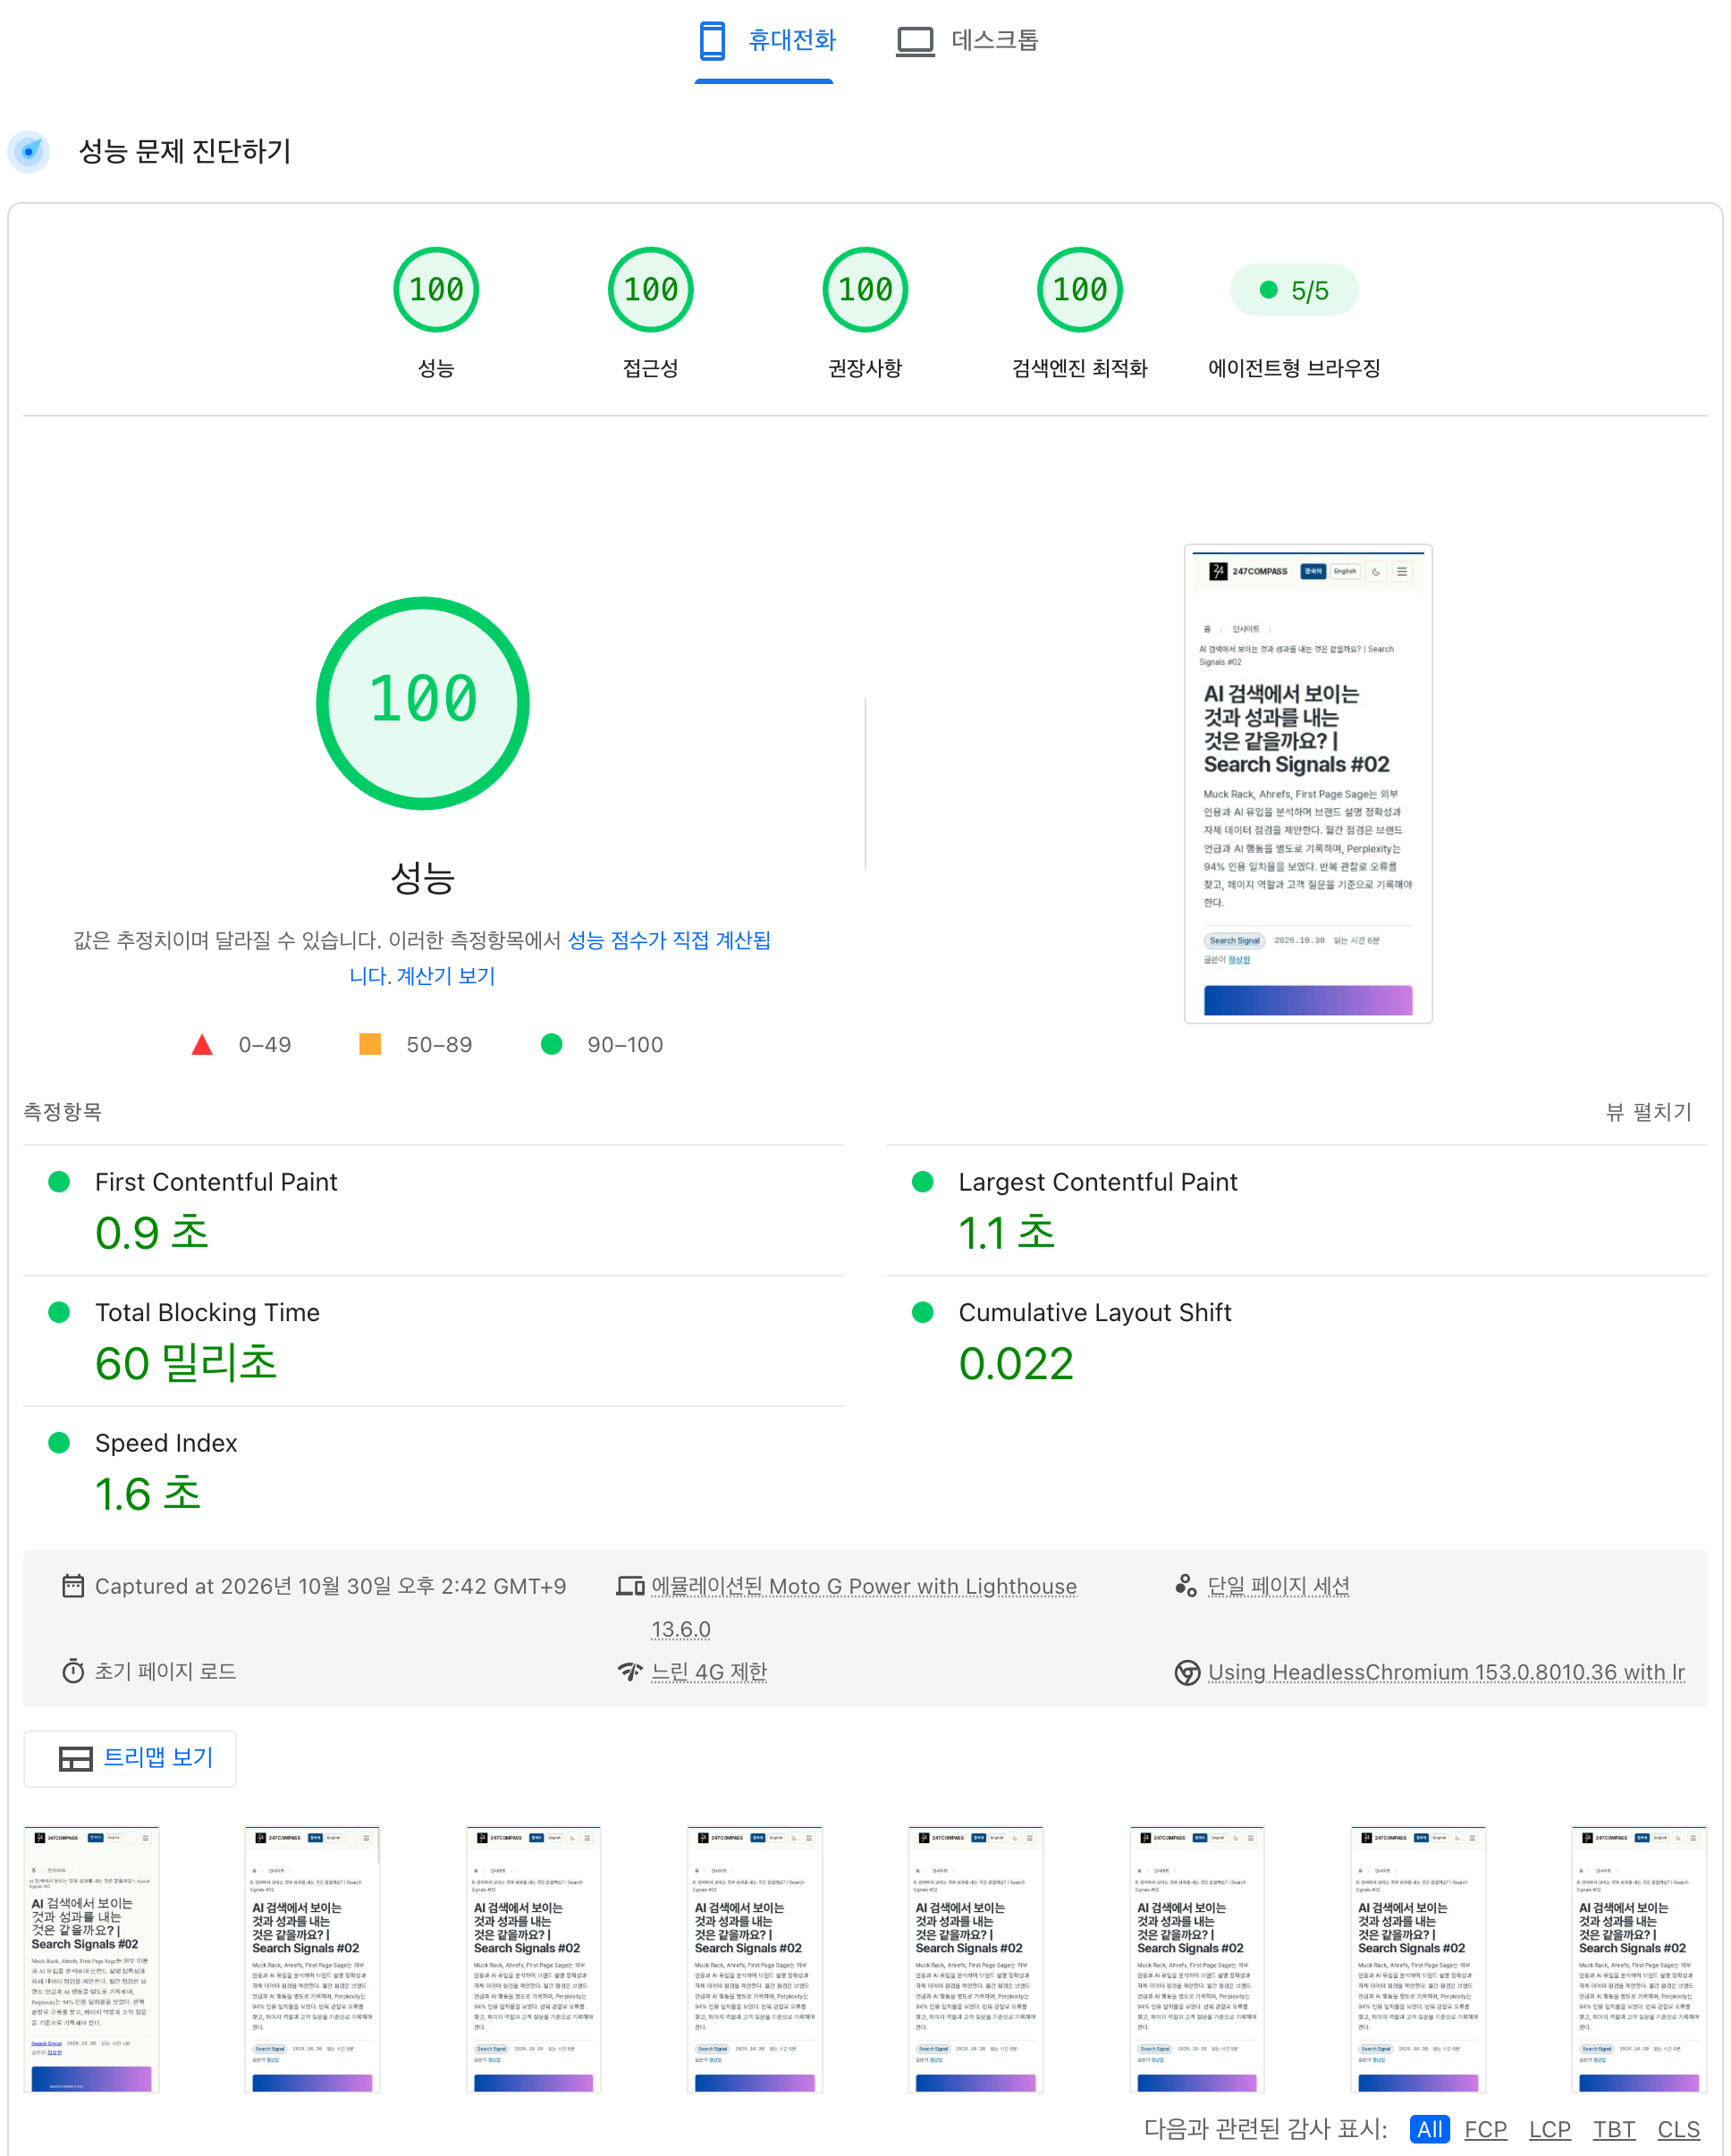
We tested the homepage and an actual content page that 247COMPASS builds and operates, using PageSpeed Insights’ mobile conditions. The screenshots below preserve the results of runs on October 30, 2026.
The homepage scored 98 for performance; the content page scored 100. Both pages also scored 100 each for accessibility, best practices and SEO, with 5/5 for agentic browsing.
| Assessment area | Home | Content |
|---|---|---|
| Performance | 98 | 100 |
| Accessibility | 100 | 100 |
| Best practices | 100 | 100 |
| SEO | 100 | 100 |
| Agentic browsing | 5/5 | 5/5 |
The first four areas are scored out of 100. The agentic browsing result records five passed audits. The screenshots retain the Korean interface. Select an image to enlarge it.


Both runs used Lighthouse 13.6.0 with an emulated Moto G Power and slow 4G conditions. The homepage recorded an LCP of 1.0 seconds, TBT of 150 milliseconds and CLS of 0.037. The content page, complete with its title, text and thumbnail, recorded an LCP of 1.1 seconds, TBT of 60 milliseconds and CLS of 0.022.
Why all five areas require attention#
Meeting the requirements across all five areas calls for separate checks on document structure, accessibility, search information and agent access, alongside speed. At 247COMPASS, we worked on these areas together:
- Performance: responsive images and WebP delivery, explicit image dimensions and loading chart code on pages that use it.
- Accessibility: heading hierarchy, table row and column headers, image alternative text and controls that can be operated with a keyboard.
- Best practices: HTTPS and security configuration, plus checks for resource errors in the browser.
- SEO: page-specific titles and descriptions, canonical URLs and HTML that crawlers can inspect.
- Agentic browsing: the accessibility tree, visual stability, WebMCP,
llms.txtandai-catalog.json.
Our practical knowledge comes from incorporating these details into the templates we operate and checking the results separately on a homepage and an article with different layouts. Maintaining high scores as content grows requires continued attention to images, scripts and document structure. It is the equivalent of adding toppings to a light crust and checking the finished pizza again.
View the November 11 follow-up measurement and agentic browsing audits
A separate report from November 11, 2026, at 11:47 p.m. KST recorded homepage performance scores of 100 on mobile and 91 on desktop. Agentic browsing was 5/5, with the following audits passed:
- Accessibility tree correctly configured.
- Valid WebMCP schema.
- Cumulative Layout Shift: 0.037.
llms.txtfollows best practices.- Valid
ai-catalog.jsonschema.
These are lab results from individual runs and can vary with testing conditions. The homepage screenshot and the November 11 report show no real-user experience data. These scores alone cannot establish performance for all users, search rankings or AI citation outcomes.
Adding the site to your home screen changes the context#
In a mobile browser that supports installation, try adding 247COMPASS to your phone’s home screen. Launch it from the icon and move between the article list and individual posts to explore the experience outside a conventional browser tab.
In standalone mode, the browser’s address bar and navigation buttons may not be visible. For that context, 247COMPASS provides dedicated styling and internal back and list navigation. If the site is opened directly without a prior navigation history, it provides a route back to the list.
These small details are part of the reading experience. Alongside making a PWA installable, operators need to design how readers move to the next page and return within it.
Toppings on a lighter crust: an interactive chart#
Where should the capacity gained through optimisation be used? At 247COMPASS, we use it for features such as tables and charts that help readers understand content.
The chart below groups 72,578 bot requests from November 4–10, 2026, covered in our previous article, by the operator labels in the data. It demonstrates a way to explore data; it is not a website performance measurement.
Select “Other 58 operator labels” in the legend below the chart. That item disappears, allowing you to compare the top five separately. Select it again to restore it. You can also select other names to leave only the items you want to compare.
View the chart's source values
| Operator label | Requests | Share |
|---|---|---|
| OpenAI | 8,285 | 11.42% |
| 6,325 | 8.71% | |
| Anthropic | 6,225 | 8.58% |
| Meta | 4,570 | 6.30% |
| Perplexity | 4,194 | 5.78% |
| Other 58 operator labels | 42,979 | 59.22% |
This chart uses data and chart code in place of an image file. Readers can hover over values and select items to explore. Its description and source figures also remain in HTML, so the information can be accessed before the chart is drawn.
Interactive charts have a cost in libraries and executable code. This site loads the relevant code on pages that contain charts. When adding a feature, we consider that cost alongside the understanding it offers the reader. Continuing to manage the available performance budget helps keep the site readable as its content grows.
What should a website gain from its diet?#
When people think about a diet, they often imagine life beyond the number on the scales: clothes they want to wear comfortably, activities they want to enjoy or photographs in which they feel more confident.
A website also needs a purpose beyond reducing its file size. Can readers start reading sooner, compare information more easily and choose their next action without delay? These are the experiences that optimisation should improve.
The targets for reduction are resources that delay reading and unnecessary execution. Content that answers customers’ questions and features that aid understanding deserve to be retained and refined. This long-standing SEO task continues as people and a wider range of automated systems access the web together.
The 247COMPASS perspective#
If technical foundations are the dough and content is the topping, optimisation is the work of refining the crust. It creates a foundation that arrives quickly, remains stable as it is read and responds promptly when a feature is needed.
Add the content your customers need and useful interactions to that lighter crust.
What content could your website deliver better by becoming lighter?